
You’ve seen it. BTC rips 18% in 36 hours, the candles go vertical, your timeline floods with rocket emojis, and something in your gut screams get in before it leaves without you. So you do. Twenty minutes later you’re underwater, watching a 9% wick obliterate your entry while the same people who pumped it are quietly explaining why they “took profit at the top.”
That’s not bad luck. That’s a parabolic exhaustion move doing exactly what it’s designed to do: pull in the last wave of retail buyers right before smart money distributes into them.
The problem isn’t that you can’t see the move. Everyone sees the move. The problem is you have no tool that tells you the difference between a trend that’s continuing and a trend that’s blowing off. That’s the gap the Shark Fin exhaustion filter inside the Smart Divergence Engine was built to close.
Why parabolic moves wreck retail traders
A parabolic move is the most emotionally violent setup in trading. Price doesn’t just rise — it accelerates. Each candle is bigger than the last. Volume spikes. RSI pins above 80 and stays there. Every cell in your body is telling you to chase.
Here’s the trap: standard retail tools are completely useless in this environment.
- RSI overbought? It’s been overbought for six candles and price doubled anyway. “Overbought” is not a signal — it’s an observation.
- Moving averages? Price is so far extended from any MA that the cross comes 12% too late.
- Standard divergence indicators? They fire a dozen fake divergence signals on the way up, train you to ignore them, and then miss the real one.
By the time the obvious tools confirm a reversal, the wick has already happened and the move is over. You need to read exhaustion — the moment buyers run out of fuel — not the move itself.
What the Shark Fin signal actually measures
The Shark Fin is an exhaustion filter layered on top of the Smart Divergence Engine’s core divergence logic. The name describes the shape it’s catching: a sharp, near-vertical spike that rolls over fast — the dorsal-fin silhouette of a blow-off top (or bottom).
Instead of just flagging “price made a higher high while RSI made a lower high” (which standard divergence tools do, and do badly), the Shark Fin layer asks a harder question: is this new high being made on collapsing momentum and a velocity profile that historically precedes a reversal?
It works by combining three things most retail indicators never connect:
- Pivot-locked divergence. The Smart Divergence Engine only confirms divergence on locked pivot points — not on every intrabar wiggle. This kills the flood of fake divergence signals that plague standard RSI tools. A pivot has to actually form before the signal is valid.
- Velocity collapse. The Shark Fin filter measures how fast the parabolic move is decelerating. A move can keep making higher highs while its rate of change is quietly dying. That divergence between price and velocity is the tell.
- Adaptive volatility bands. The engine widens and tightens its reference bands based on current volatility, so a Shark Fin on a sleepy XAU range and a Shark Fin on a violent NQ session aren’t held to the same static threshold.
The result: instead of a top being “obvious” only in hindsight, you get a flagged exhaustion condition while the parabolic candle is printing — when there’s still a trade to take.
What it looks like on a real chart
Picture a typical BTC parabolic blow-off. Price runs from $61,000 to $69,000 in two sessions. The last leg is four consecutive expanding green candles. Retail is screaming “new ATH incoming.”
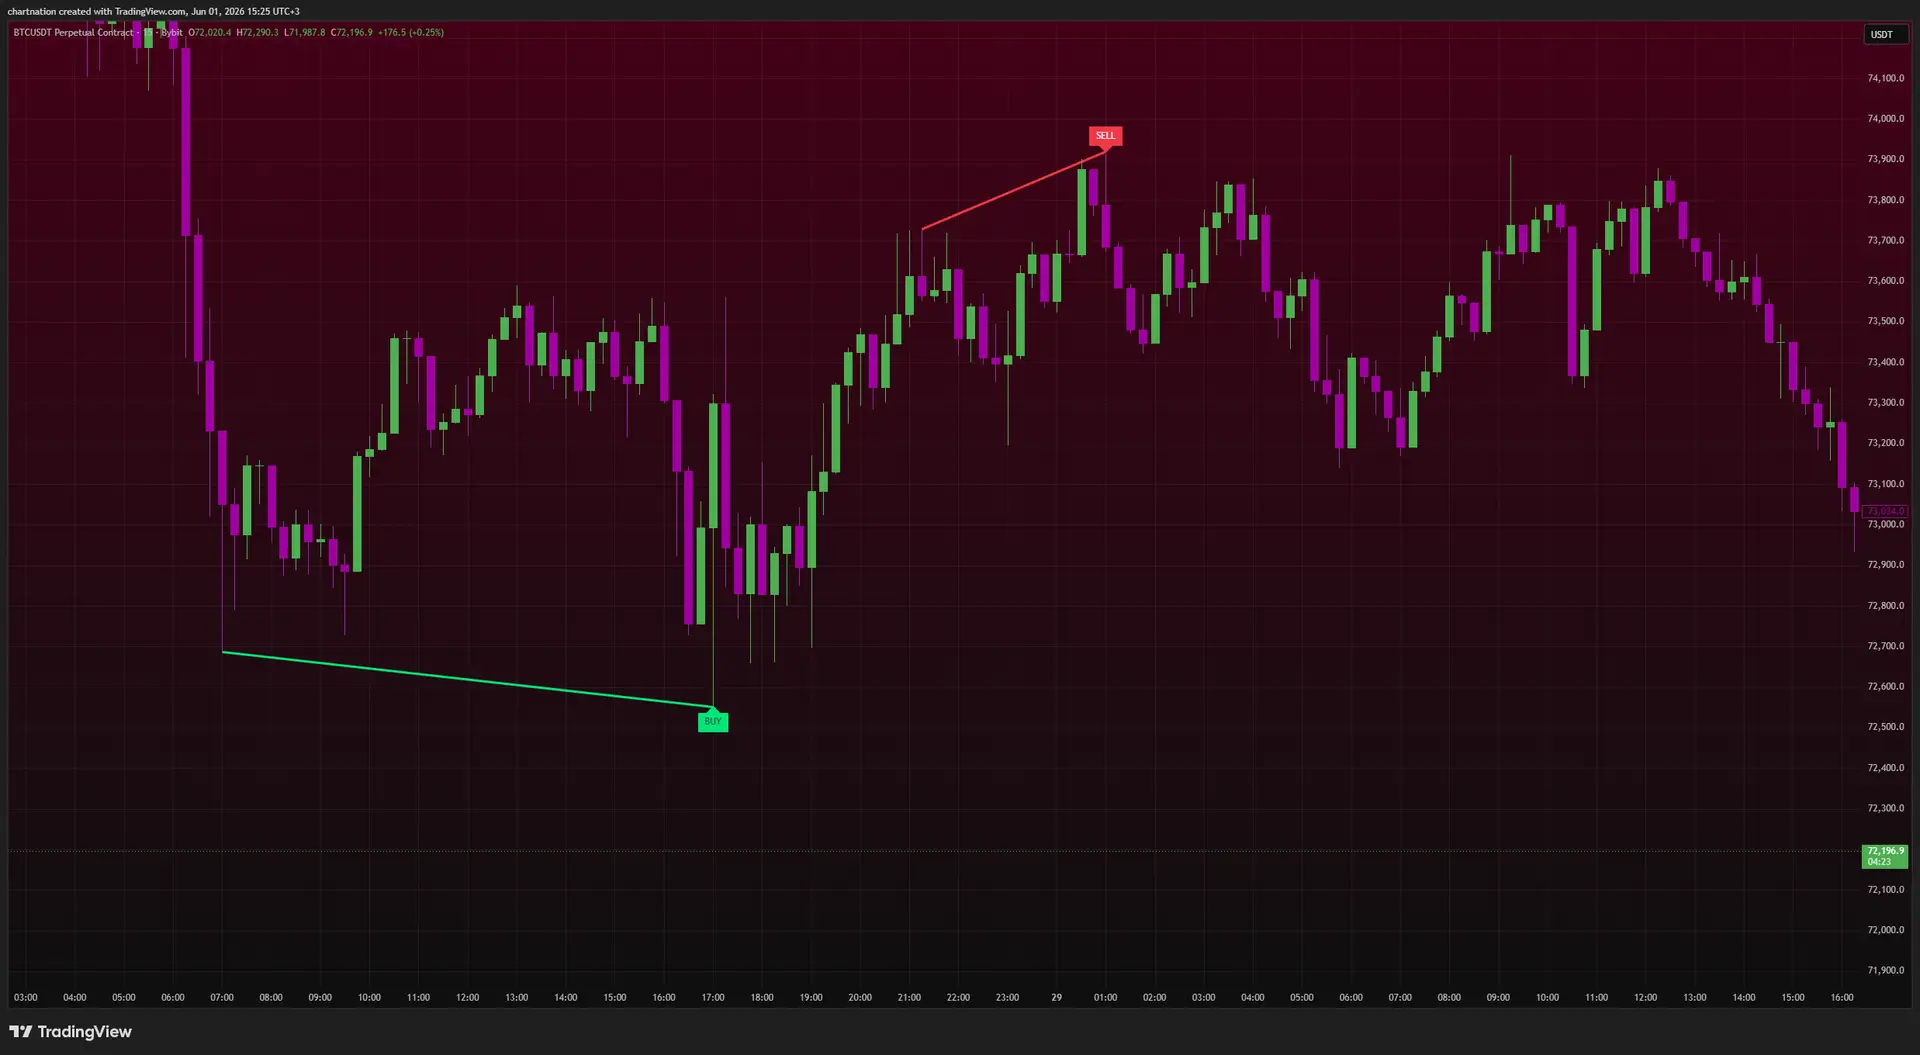
Watch what happens here. The Smart Divergence Engine has locked a pivot high at $66,400. Price pushes to $68,900 — a clean higher high. But RSI prints a lower high, and the Shark Fin velocity filter registers that the second leg covered more price on dramatically less momentum. The bands are stretched to the upside. The Shark Fin condition fires.
That’s not a guarantee of a reversal — nothing is. But it’s the difference between blindly chasing the fourth green candle and recognizing that the people who started this move are now selling into your buy order.
Show me a standard RSI indicator that can tell the difference between a strong trend continuation and a velocity-collapsing blow-off. It can’t. It just says “overbought” and lets you get run over.
It works both ways — exhaustion bottoms too
Parabolic moves aren’t just topside. Capitulation flushes are exhaustion in the opposite direction. When ES futures puke 3% into a session low on a panic cascade, the same logic inverts: price makes a lower low, momentum makes a higher low, velocity is collapsing on the downside, and the Shark Fin fires a bullish exhaustion flag.
This is exactly where retail does the second dumbest thing it can do — panic sells the literal bottom — while the exhaustion signal is telling you sellers are out of ammunition. Gold does this constantly around news events: a violent XAU spike down, a Shark Fin print, and a snap-back recovery that traps the late shorts.
How to actually trade it (without guessing)
An exhaustion signal on its own is a heads-up, not a trade. The whole ChartNation philosophy is confluence — never trade a single signal in isolation. Here’s how serious traders stack the Shark Fin into a real, rules-based setup:
- Layer in volume. Pull up Volume Matrix Pro (it’s free) and check whether the parabolic candle is hitting a known HVN or stalling at the Point of Control. An exhaustion signal that lands at a high-volume rejection level is far stronger than one in thin air.
- Check order flow. Run Flow Dynamics Pro and read its 0–100 confluence score. A Shark Fin that prints while Flow Dynamics shows institutional zones flipping from accumulation to distribution is a different conversation than one with no order-flow backing.
- Confirm trend context with SMAD. The Smart Moving Average Dynamics (SMAD) oscillator tells you whether the broader trend is still intact or rolling. An exhaustion reversal against a fresh, strong trend is a fade you size small; one that lines up with a stalling SMAD is a higher-probability turn.
- Map your targets. Don’t guess your exit. Pattern Confluence Pro (PCP) gives dual-tier targets (T1/T2) when the exhaustion coincides with a wedge or channel structure, so you’re managing the trade by levels, not emotions.
When three or four of these align — pivot-locked divergence, Shark Fin velocity collapse, a volume rejection level, and a deteriorating order-flow score — that’s a high-probability setup. That’s the edge. Not one magic line, but stacked evidence that the parabolic move is out of fuel.
Why this matters more on 24/7 markets
Crypto runs around the clock with no closing bell to reset momentum, which is exactly why BTC produces some of the cleanest — and most brutal — parabolic exhaustion moves on any chart. There’s no overnight gap to absorb the move; it just goes vertical until it doesn’t. The adaptive volatility bands in the Smart Divergence Engine matter here because a 4% candle on BTC and a 4% candle on a slow forex pair are not the same animal, and a static threshold treats them as if they are.
Stop chasing the top
The traders who survive parabolic moves aren’t the ones with the fastest fingers or the most conviction. They’re the ones who can read exhaustion while everyone else reads excitement. The Shark Fin filter inside the Smart Divergence Engine exists to give you that read — pivot-locked, velocity-aware, and volatility-adaptive — so you stop being the liquidity that smart money distributes into.
The Smart Divergence Engine, including the Shark Fin exhaustion filter, is available on the Pro and Ultimate tiers. You can test it on your own charts — BTC, XAU, ES, NQ, whatever you trade — risk-free for 7 days. Start your 7-day free trial at chartnation.net and see what the next blow-off top looks like with an exhaustion filter on your side.
Trading involves significant risk of loss. ChartNation indicators are tools for analysis only and do not constitute financial advice. Past performance shown is not indicative of future results.