You’re staring at a green volume bar that’s twice the size of everything around it. Price barely moved. So what does that bar actually mean? Were buyers slamming into a wall of sellers? Or were sellers dumping into desperate buyers? A standard volume histogram can’t tell you. It shows you the size of the fight — but not who won it. And that missing piece is exactly why retail traders get trapped at tops and shaken out at bottoms.
Delta volume analysis fixes that. It separates total volume into buying pressure versus selling pressure, so you can see who’s actually in control on every candle, in real time. While retail stares at raw volume and guesses, traders reading delta know whether that big bar was accumulation or distribution. Let’s break down how it works and how to use it.
What Delta Volume Actually Measures
Delta is the difference between volume executed at the ask (aggressive buying) and volume executed at the bid (aggressive selling) within a given bar or price bin.
Delta = Buy Volume (market orders hitting the ask) − Sell Volume (market orders hitting the bid)
A positive delta means aggressive buyers dominated that period. Negative delta means aggressive sellers won. The magnitude tells you by how much. This matters because price is moved by aggression — by traders willing to pay up or sell down right now — not by passive limit orders sitting in the book.
Here’s the key insight retail misses: volume tells you participation, delta tells you intent. Two candles can have identical 5,000-contract volume on NQ, but one with +3,800 delta and one with −3,200 delta are telling you opposite stories. One is buyers absorbing supply. The other is sellers steamrolling demand. Same bar height. Completely different trade.
Why Standard Volume Lies to You
The classic retail mistake: “Volume confirms the breakout.” You see price punch above resistance on a fat volume bar, you buy, and 20 minutes later you’re underwater. What happened?
That fat volume bar was the move getting sold into. Buyers were aggressively lifting offers, sure — but smart money was unloading size into every one of those market buys. The total volume looked bullish. The delta was screaming distribution. Raw volume averaged both sides into a single bar and hid the truth.
This is the single most common way breakouts trap traders:
- Bullish breakout, negative delta: price pushes higher but sellers are absorbing the buying. The move fails.
- Selloff, positive delta: price drops but buyers are aggressively stepping in underneath. A reversal is brewing.
- Delta divergence: price makes a new high while delta makes a lower high. The aggression behind the move is fading.
None of this is visible on a regular volume histogram. You need volume that’s split by side — and ideally split by price level, not just by time.
Reading Delta at the Price Level: Where the Edge Lives
Time-based delta (per candle) is useful, but the real institutional read comes from delta at each price level. That’s where you see exactly which prices buyers defended and which prices sellers attacked.
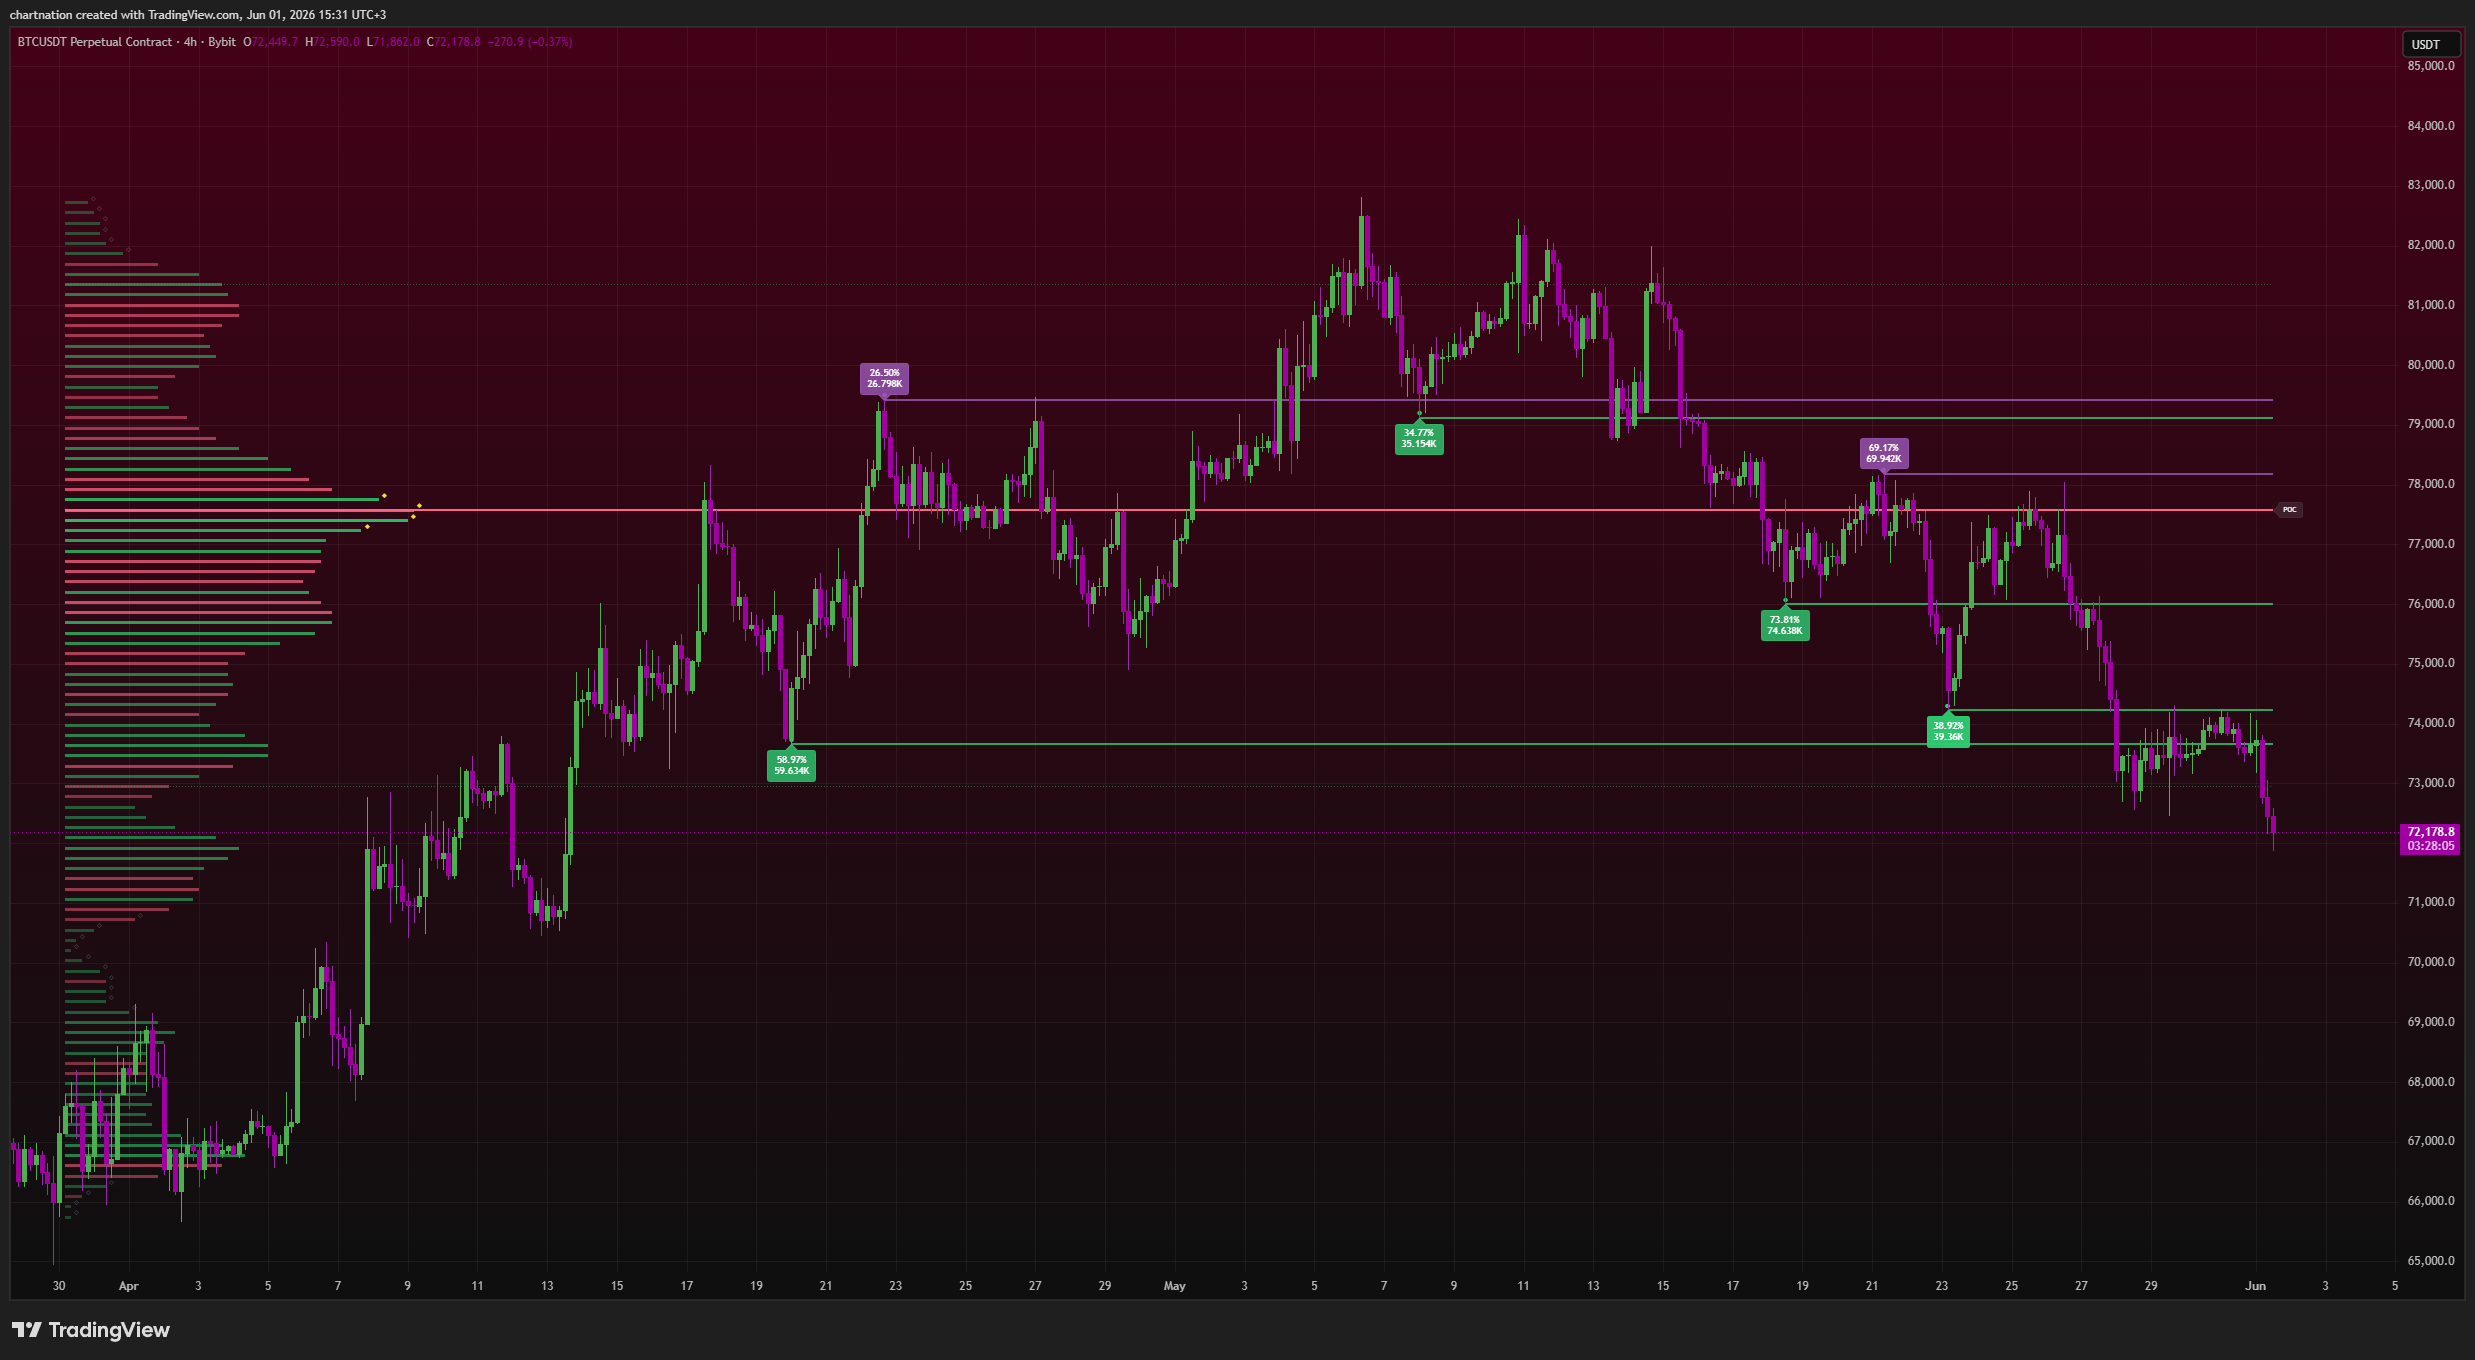
This is what Volume Matrix Pro — ChartNation’s free TradingView indicator — is built for. It paints delta-colored volume bins directly onto the price axis, so instead of one flat histogram at the bottom of your chart, you see a horizontal profile showing buy/sell dominance at every price. Combine that with its HVN/LVN detection and Point of Control, and you stop guessing where the battle is being fought.
The four things to look for
- Delta-colored bins: green-weighted bins mean buyers dominated at that price; red-weighted bins mean sellers did. A cluster of strongly positive delta bins under current price is a demand shelf. Strongly negative delta bins above price is supply.
- High Volume Nodes (HVN): price levels where huge volume traded. These act as magnets and decision points. When an HVN shows positive delta, it’s an accumulation zone — a level smart money defended.
- Low Volume Nodes (LVN): thin areas price tends to rip through fast. Price rarely sits on an LVN — it gets rejected or accelerates.
- Point of Control (POC): the single price with the most traded volume. It’s a gravity center. Price drifts back to it, and how delta behaves at the POC tells you whether the level holds or breaks.
A Concrete Example: BTC Reclaiming a Level
Say Bitcoin sweeps down to $58,000, an area that earlier built a thick HVN. On a standard chart you just see a wick and a bounce. With delta-colored volume bins, you see something far more useful: as price tagged $58,000, the bins lit up heavily positive — aggressive buyers absorbing every market sell. That’s not a random bounce. That’s demand showing its hand.
Now contrast it with a fake-out. BTC pushes to a new local high at $62,500 on big volume, and retail piles in. But the bins at $62,500 print negative delta — sellers distributing into the rally. Price stalls, rolls over, and revisits the POC. The trader watching delta didn’t chase the high; they saw the aggression was on the sell side and stood aside, or faded it.
This same logic applies everywhere TradingView does:
- XAU (Gold): delta at a prior swing high tells you whether breakout buyers are real or whether sellers are capping the move.
- ES / NQ Futures: futures are perfect for delta because of centralized volume. A positive-delta absorption at a key LVN during the cash open often precedes the trend leg of the day.
- Crypto 24/7: with no session breaks, delta on BTC and ETH gives you a continuous read on who’s accumulating through the overnight chop.
Delta Divergence: The Signal Behind the Reversal
The most powerful delta read is divergence between price and aggression. Price makes a higher high. Delta makes a lower high. Translation: the move is getting fewer and weaker aggressive buyers at each push. The crowd is buying; the smart money is done. This is your early warning that momentum is hollow.
The reverse at lows is just as valuable. Price makes a marginally lower low, but delta makes a higher low — sellers are running out of ammo. That’s where reversals are born, and it’s exactly the kind of context that turns a coin-flip entry into a high-probability setup.
This is where stacking tools multiplies your edge. Delta divergence from Volume Matrix Pro lining up with a pivot-locked RSI divergence from the Smart Divergence Engine, near an institutional zone flagged by Flow Dynamics Pro with a confluence score in the 80s, is the kind of layered confirmation retail traders never build. One signal is a guess. Three aligned signals is a process.
How to Build Delta Into a Repeatable Process
Reading delta is only an edge if you use it the same way every time. A simple rules-based framework:
- Mark the structure: identify the POC, the major HVN, and the key LVN zones for your timeframe.
- Wait for price to reach a decision level: don’t act in the middle of nowhere. Let price come to an HVN, the POC, or a swing extreme.
- Read the delta at that level: is aggression confirming the move or absorbing it? Positive delta into support = buyers defending. Negative delta into resistance = sellers capping.
- Check for divergence: is the aggression behind the latest push growing or fading?
- Demand confluence: only take the setup when delta agrees with at least one other tool — divergence, order flow zone, or a confirmed pattern from Pattern Confluence Pro (PCP).
That’s how you go from reacting to volume bars to actually reading the market’s intent. You stop chasing breakouts and start fading the traps — because you can see which side is really in control.
The Bottom Line
Total volume tells you a fight happened. Delta tells you who won. Until you can see buying versus selling pressure at the price level, you’re trading half the picture — and the half you’re missing is the half institutions are using against you. Delta-colored bins, HVN/LVN context, and POC awareness turn a confusing volume histogram into a clear map of where smart money is positioned.
The best part? You can start reading delta on TradingView today with Volume Matrix Pro — it’s free. And when you’re ready to stack it with institutional order flow, divergence, and pattern confluence, the full suite is one click away.
Start your 7-day free trial at ChartNation and add institutional-grade delta and volume tools to your TradingView charts. Stop guessing what volume means — start seeing who’s actually in control.
Trading involves significant risk of loss. ChartNation indicators are tools for analysis only and do not constitute financial advice. Past performance shown is not indicative of future results.