You drew a support line. Price tagged it. You entered long. Five minutes later you’re stopped out and price is ripping in your face. Sound familiar? The problem isn’t your discipline — it’s that you’re trading horizontal lines drawn from candle wicks while institutions are trading where actual volume changed hands. That’s the gap a volume profile closes.
While retail stares at price, smart money watches volume at price. This is the single most important shift you can make in how you read a chart. Let’s break down exactly what a volume profile is, why HVN and LVN levels dictate where price reacts, and how to use them to time entries that don’t get faked out.
What Is a Volume Profile?
A standard volume indicator — the histogram at the bottom of your chart — tells you how much volume traded during each time period. Useful, but incomplete. It answers “when,” not “where.”
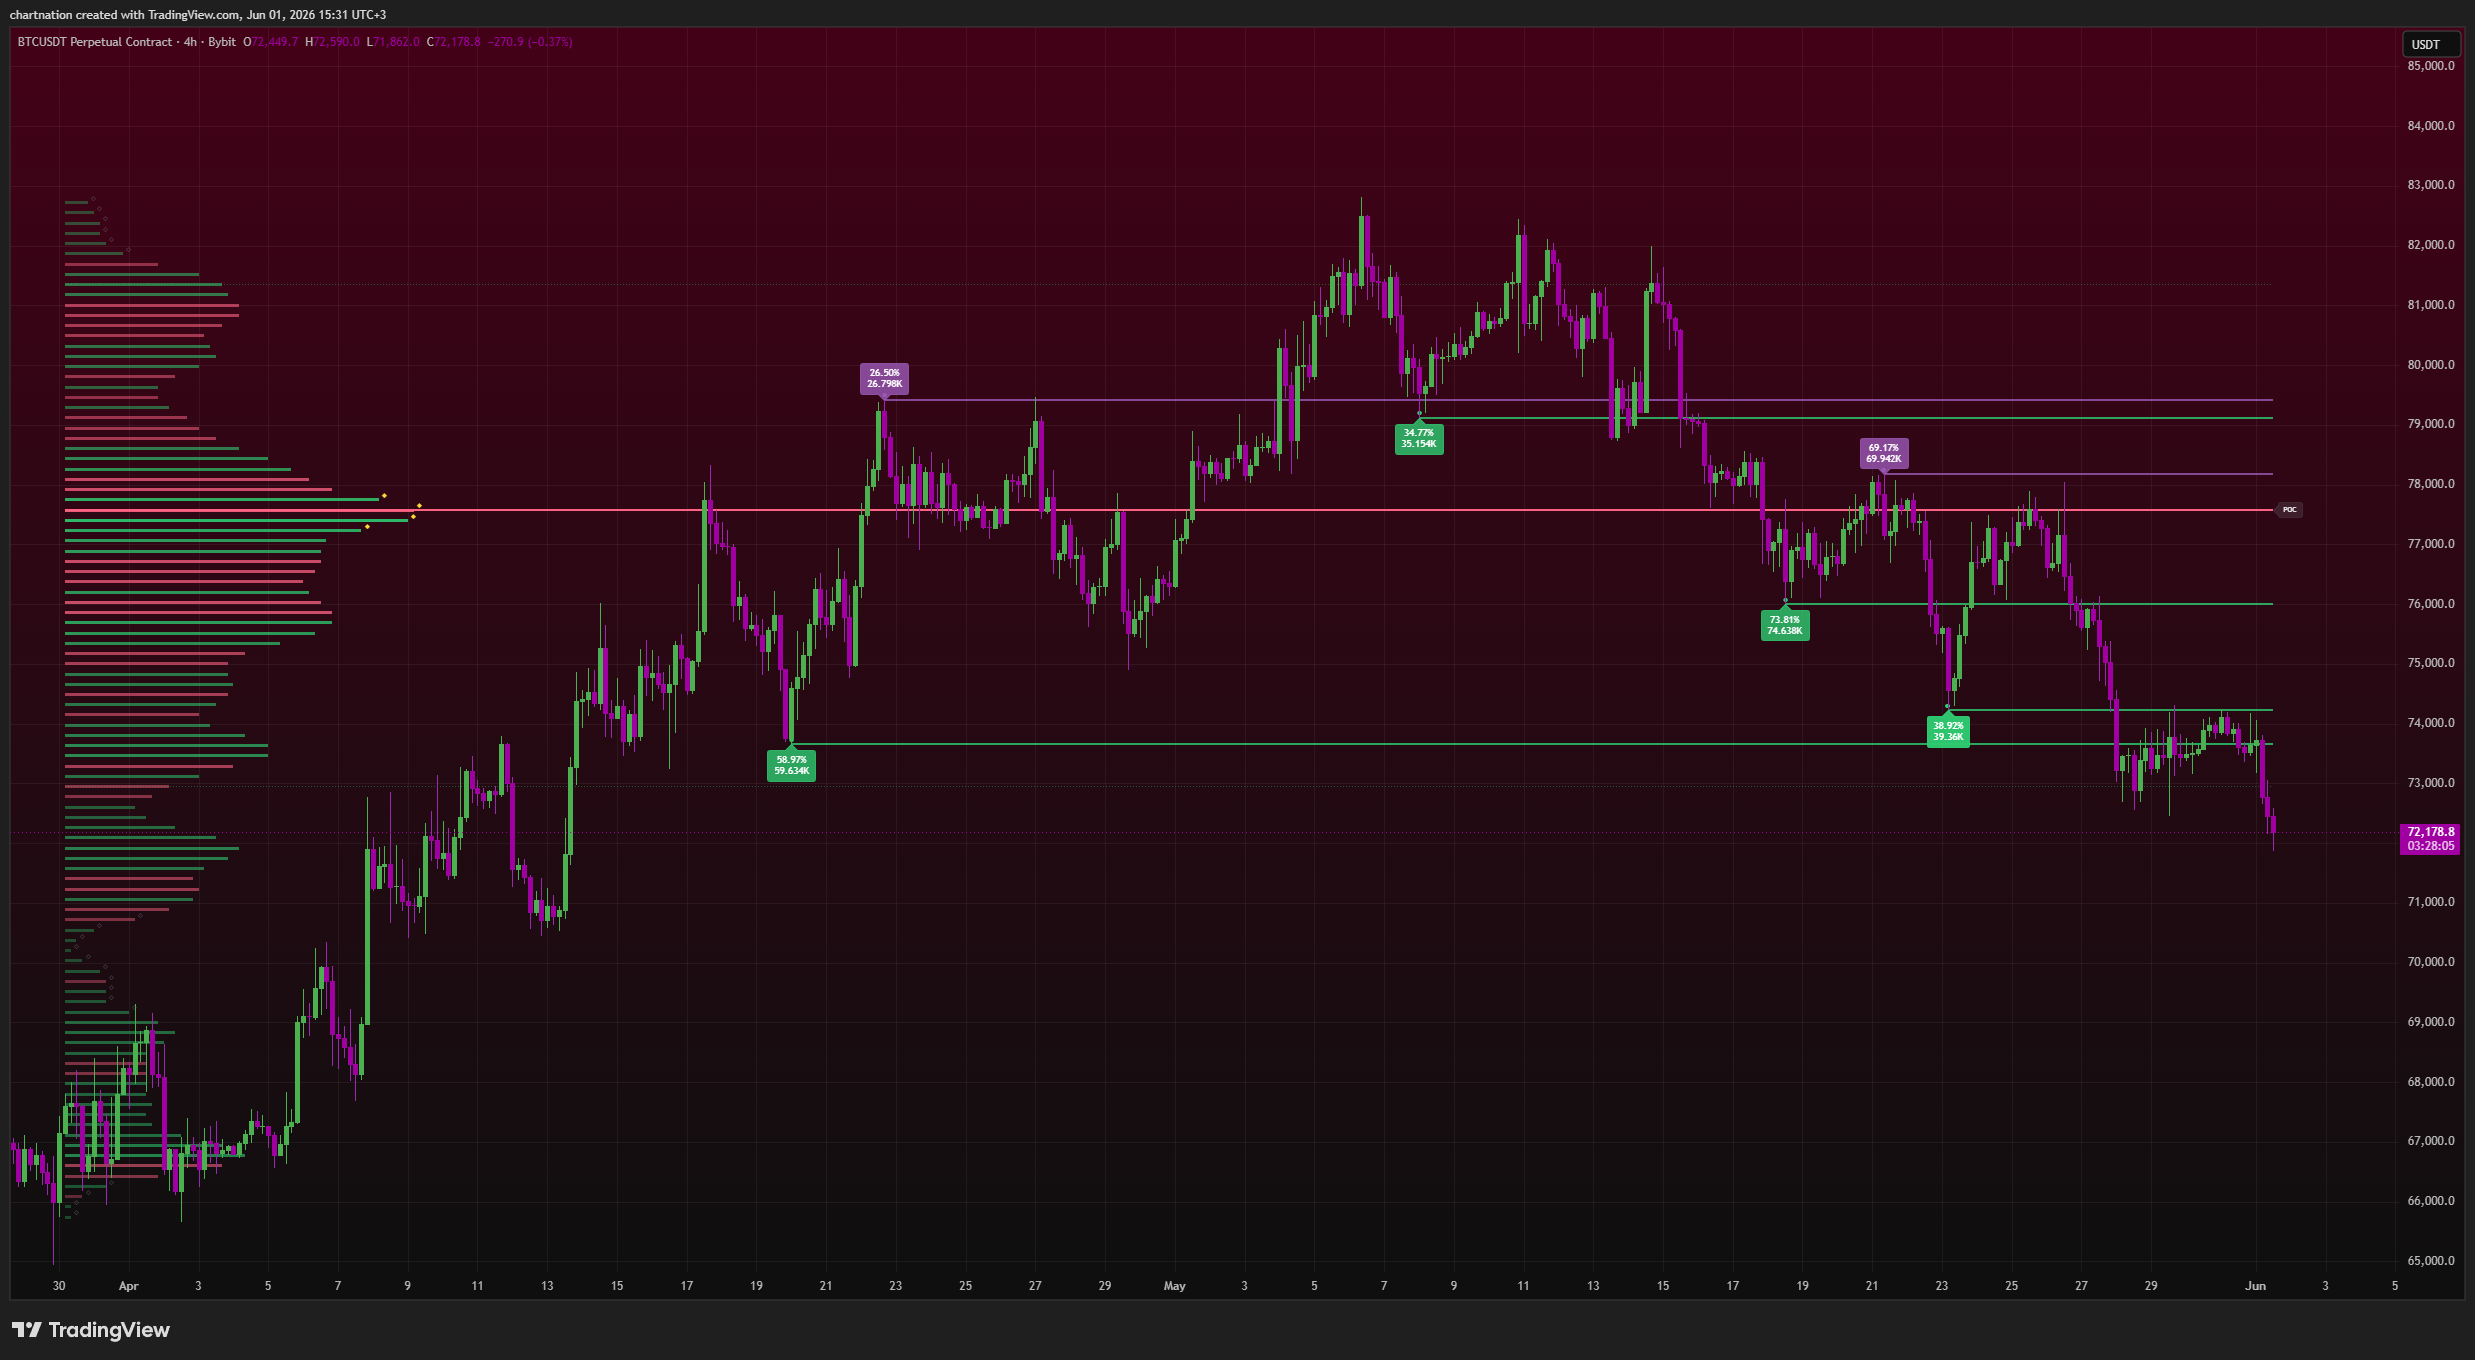
A volume profile flips the axis. Instead of plotting volume across time horizontally, it plots volume across price vertically. The result is a sideways histogram that shows you exactly how much trading activity occurred at every single price level over your chosen range.
This matters because price levels with heavy volume are levels where institutions did business. They built positions there. They have skin in the game there. And they will defend those levels. Price levels with thin volume? Nobody cares about them — price slices through like a hot knife.
The chart doesn’t lie about where the money went. A volume profile just forces you to look at it.
HVN vs. LVN: The Two Levels That Run Your Chart
Once you’ve got a profile up, two structures matter more than anything else:
High Volume Nodes (HVN)
An HVN is a price level — or cluster of levels — where a disproportionate amount of volume traded. These are the fat parts of the profile. They represent acceptance: the market spent serious time and capital agreeing that this price was fair.
HVNs act like magnets and like walls. Price tends to:
- Get pulled toward them when trading in thin air above or below
- Stall and chop when it enters them, because there’s a war of orders to absorb
- Bounce off them cleanly when approached from a distance with momentum
Real example: on the 4H ES Futures chart, if you see a thick HVN built around 5,420 from three days of consolidation, that level becomes a battleground. Longs entered above it will defend it. Shorts trapped below will cover into it. That’s your reaction zone — not some random trendline.
Low Volume Nodes (LVN)
An LVN is the opposite — a price level where almost no volume traded. These are the gaps and pinches in the profile. They represent rejection: the market took one look at this price and ran away from it fast.
LVNs are pure gold for entries because price moves through them quickly and rarely lingers. Practically:
- Price accelerates through LVNs — they’re the air pockets between value
- An LVN often marks the edge of a move — once price re-enters a low-volume zone, it tends to keep going to the next HVN
- LVNs make excellent stop placement zones — if price is sitting in a low-volume area, it shouldn’t stay there, so a tight stop just inside an LVN is logical
On BTC, you’ll constantly see LVNs between major accumulation ranges. When price breaks out of a tight $61,000–$62,000 HVN and there’s nothing but thin volume up to $64,500, that empty stretch is your runway. Price doesn’t want to be there — it wants the next pocket of acceptance.
The Point of Control (POC): The Magnet Level
Inside every profile sits the Point of Control (POC) — the single price level with the most traded volume in your range. It’s the fairest price the market has agreed on, and it behaves like a gravitational center.
Why traders obsess over the POC:
- Price tends to revert back to it during balanced, range-bound conditions
- A POC that holds as support or resistance confirms which side controls the auction
- When price rejects the POC cleanly and leaves, that’s often the start of a directional move (trend day)
On XAU/USD, watch how gold repeatedly returns to its daily POC during quiet European sessions, then explodes away from it when the New York open brings real volume. The POC is your reference point for whether the market is balanced or about to break.
Why This Beats Standard Support/Resistance
Here’s the brutal truth: most retail support/resistance lines are drawn from price extremes — wicks, swing highs, swing lows. But a wick is where price failed. There’s almost no volume there. You’re drawing your most important decision levels at the exact spots the market rejected.
Volume profile levels are built from where the money actually traded. That’s why HVNs hold and LVNs get blown through. Show me any horizontal-line strategy that explains why a level matters — volume profile tells you the reason, not just the location.
How to Trade HVN/LVN Entries (Concrete Setups)
1. The HVN Bounce
Price approaches a well-defined HVN from outside with momentum, then stalls. You wait for confirmation — a rejection candle, a delta shift — and enter in the direction of the bounce. Stop goes on the far side of the node. Target the next LVN edge.
2. The LVN Breakout Runner
Price breaks out of an HVN and enters an LVN. Because nobody wants to trade in that empty zone, price accelerates. You enter on the break, ride through the air pocket, and take profit at the next HVN where buyers/sellers will reload.
3. The POC Reversion
In a balanced market, price extends away from the POC into a low-volume area. You fade the extension, targeting a return to the POC. This is a range-day play — and knowing whether the day is balanced or trending is the whole game.
Stop Guessing Where Volume Sits — Map It Automatically
You can eyeball a profile, but precision wins. This is exactly what Volume Matrix Pro was built for — and it’s free. It plots delta-colored volume bins so you see buying vs. selling pressure at each level, automatically flags HVN and LVN zones, adapts pivots to current structure, and marks the Point of Control as a live magnet level. No more manually fixed-range profiling and hoping you set the lookback right.
For traders who want to go deeper, Volume Dynamics Pro takes it further with advanced butterfly profiles and gradient bias scoring — showing you not just where volume sits, but which direction that volume is leaning. Pair either with Flow Dynamics Pro and its 0–100 confluence score, and you stop guessing whether an HVN will hold — you get a quantified read on institutional order flow stacking at that level.
That’s the difference between retail and institutional-grade analysis: retail draws a line and hopes. You map where the money actually is and trade the reaction.
Build the Habit, Then Build the Edge
Start simple. Add a volume profile to your most-traded asset — BTC, ES, NQ, XAU, whatever you live on. Mark the POC. Identify the two or three biggest HVNs and the obvious LVN gaps between them. Watch how price respects them for a week. You’ll never look at a naked chart the same way again.
Then upgrade your tooling so you’re not doing it by hand on every timeframe. Volume Matrix Pro is free to add on TradingView, and the full institutional-grade suite is available on a 7-day free trial — no commitment, full access.
Start your 7-day free trial at ChartNation and start trading where the volume actually is, not where the crowd guesses it should be.
Trading involves significant risk of loss. ChartNation indicators are tools for analysis only and do not constitute financial advice. Past performance shown is not indicative of future results.