You watched price rip 3% in 20 minutes. Your RSI finally crossed, your MACD finally turned green, and by the time both lined up, the move was over. You entered at the top. Sound familiar?
That’s not bad luck. That’s the structural problem with retail indicators: they react to price after the fact. RSI, MACD, stochastics, basic moving averages ” hat closing data everyone else is staring at. They tell you what already happened. They tell you nothing about who was buying, how aggressively, or where the real money is parked.
Institutional desks don’t trade off a lagging oscillator. They trade off order flow ”
delivered, where liquidity sits, and where large positions are being accumulated or distributed. The good news: you can read a meaningful version of that flow directly on TradingView. The bad news: the default toolset won’t get you there. Let’s fix that.
What “Order Flow” Actually Means (No Fluff)
Order flow is the real-time battle between buyers and sellers ”
closing print. When a market maker absorbs thousands of contracts at a level and price refuses to drop, that’s flow. When aggressive buyers lift every offer on the way up, that’s flow. When volume spikes 400% at a price node and then price stalls, smart money is doing something ”
and retail is about to be on the wrong side of it.
Three components matter:
- Volume delta ”
g (lifting offers) vs. aggressive selling (hitting bids). - Volume nodes ”
high-volume nodes (HVN) and low-volume nodes (LVN). - Absorption and exhaustion ”
the size that’s moving it. That’s where reversals are born.
Retail tools collapse all of this into a single line that lags by definition. To read flow, you need tools built to surface it.
Why Standard Retail Indicators Miss It
Show me any standard RSI that tells you whether the volume behind a move was institutional accumulation or a retail FOMO spike. It can’t. RSI only sees price. MACD only sees moving-average spreads. A basic volume histogram shows total volume but tells you nothing about direction ”
were those green bars buyers or sellers? You’re guessing.
Here’s the institutional-vs-retail gap in plain terms:
- Retail sees: “Volume was high on that candle.”
- Institutions see: “Volume was high, delta was negative, price didn’t follow through ”
sellers got absorbed, expect a reversal up.”
Same chart. Completely different read. That’s the edge you’ve been missing ”
because you didn’t have a worse strategy.
Step 1: Map the Battlefield With Volume Matrix Pro (Free)
Before you read flow, you need to know where it matters. That’s volume structure. Volume Matrix Pro ”
ChartNation’s free indicator ”
volume bins, automatically detects HVN and LVN levels, plots adaptive pivots, and marks the Point of Control (POC) ”
the price where the most volume traded.
Why does this matter? The POC acts like a magnet. On BTC, when price drifts away from a clean POC at, say, $61,200 and volume thins out into an LVN above, price frequently snaps back toward that POC. The HVN levels are where institutions have inventory ”
they defend them. The LVN gaps are where price moves fast because there’s no liquidity to slow it down.
Translation: HVNs are where you expect reactions. LVNs are where you expect acceleration. Knowing the difference is half the battle, and it costs you nothing to start ”
Volume Matrix Pro is free.
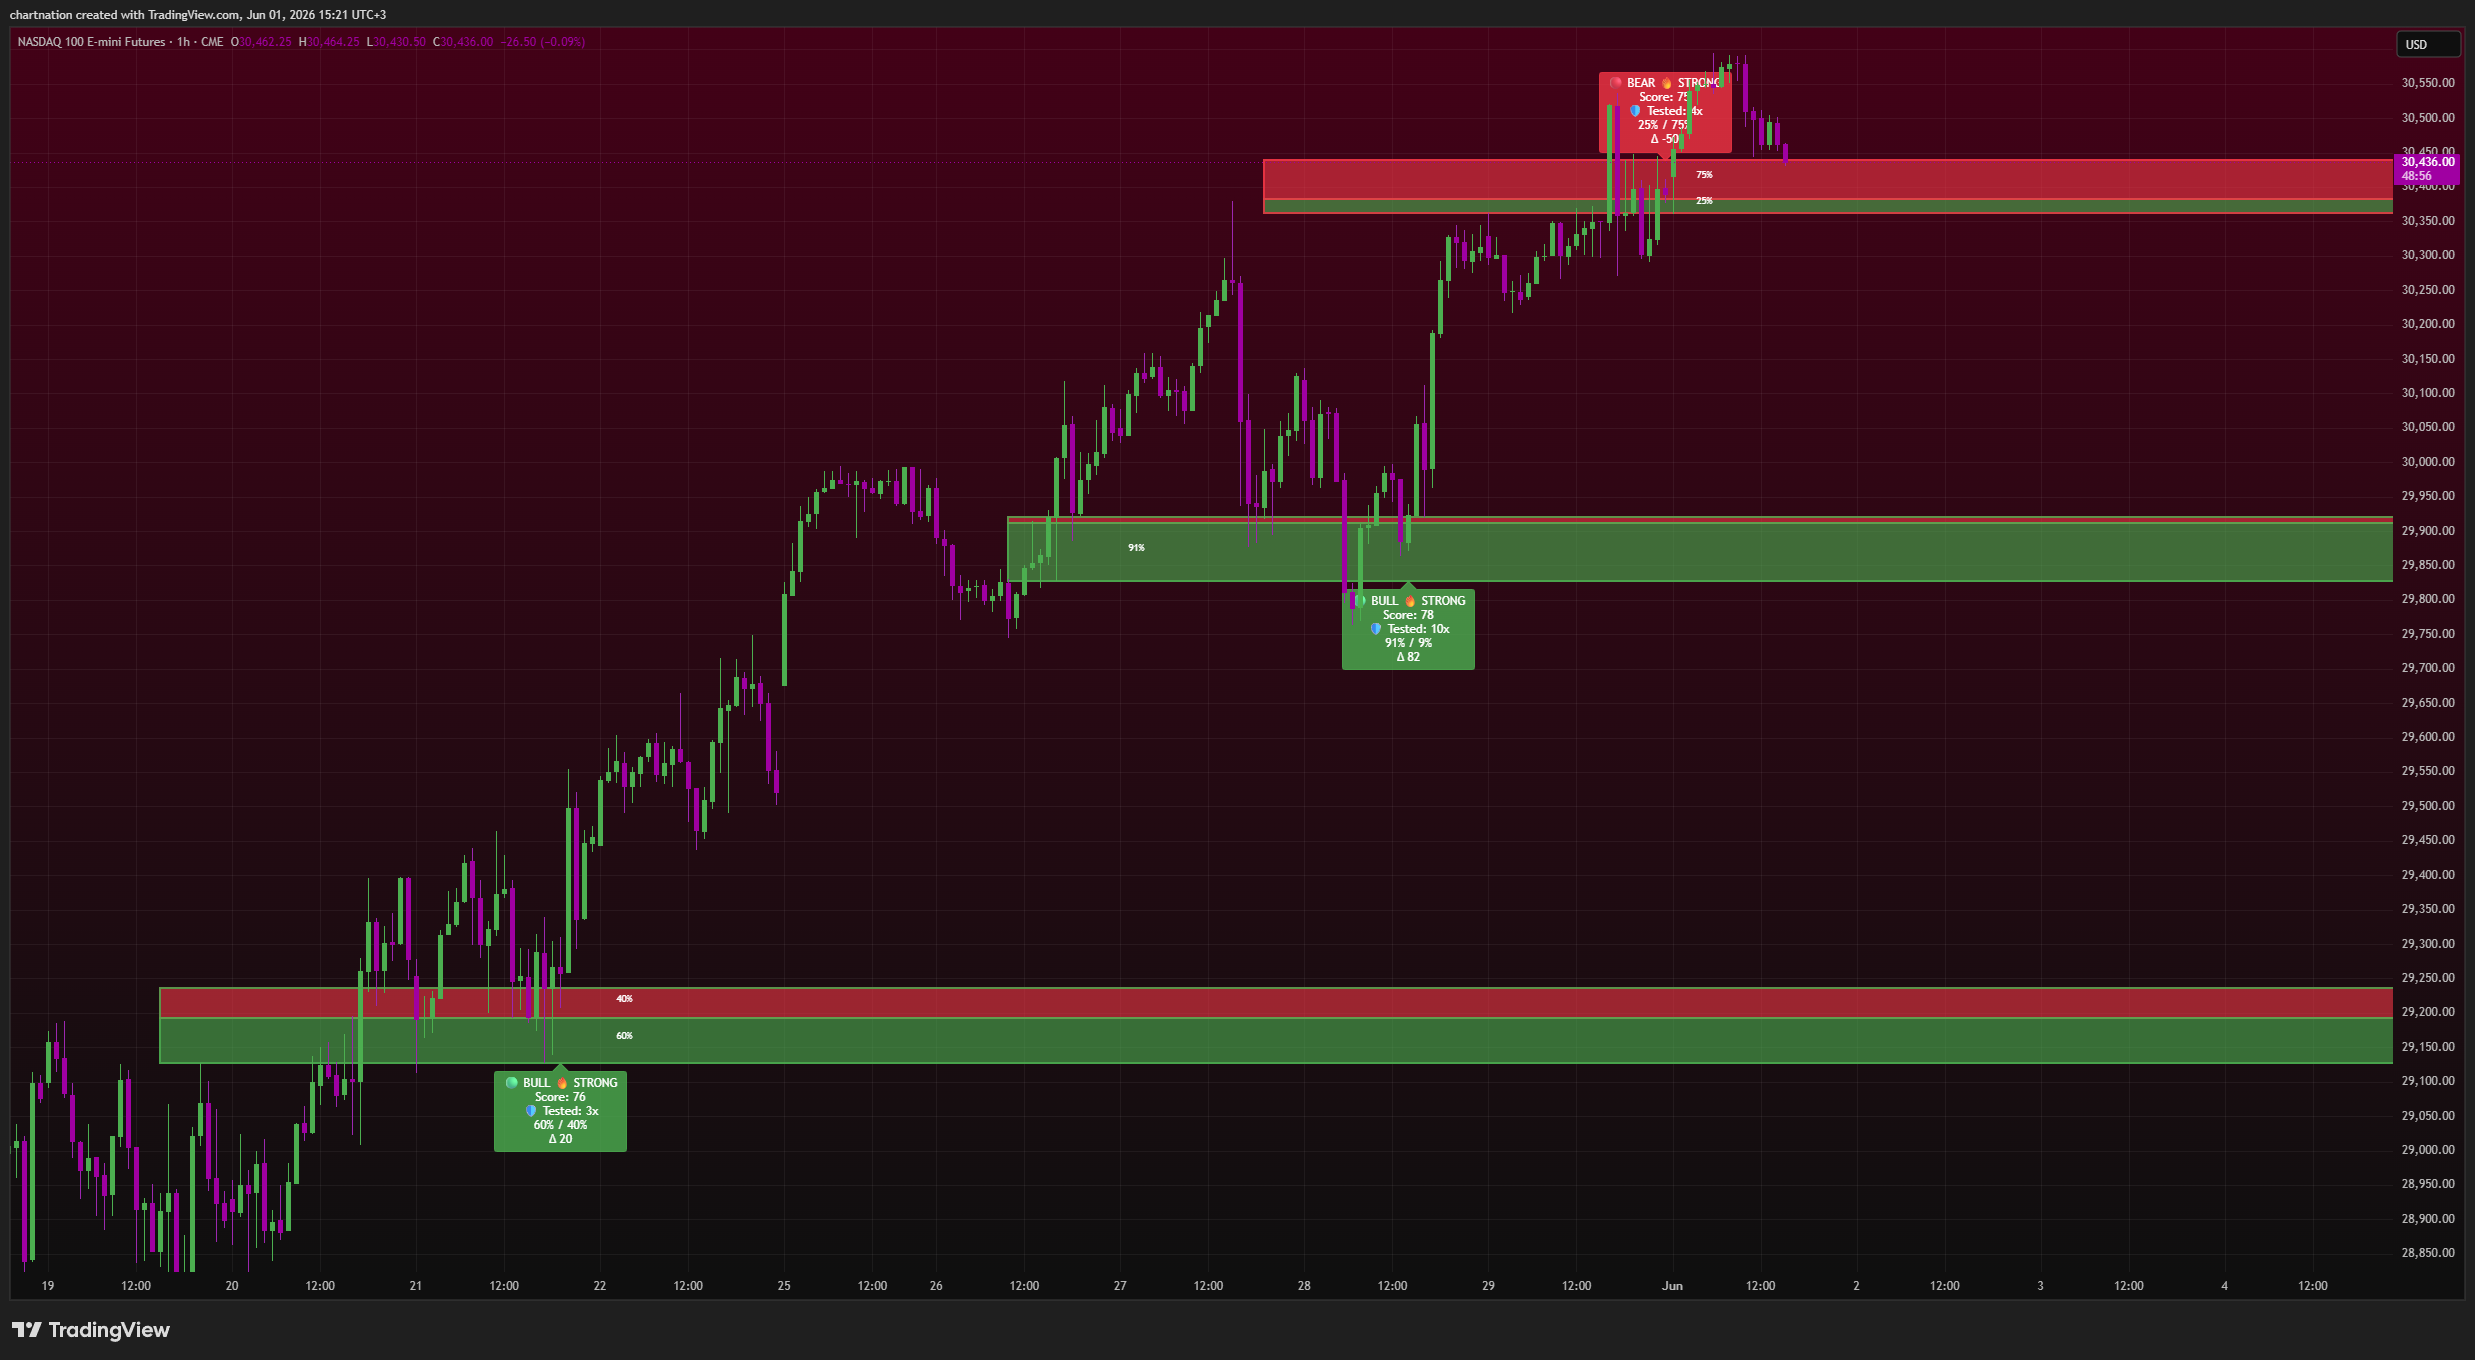
Step 2: Find the Institutional Zones With Flow Dynamics Pro
Once you’ve mapped structure, you need to know which zones smart money actually cares about right now. This is where Flow Dynamics Pro separates a guess from a high-probability setup.
Flow Dynamics Pro plots institutional order flow zones and ”
the part that kills the guesswork ”
assigns each one a confluence score from 0 to 100. A zone scoring 30 is noise. A zone scoring 85 is where multiple factors stack: volume concentration, prior reaction, delta confirmation, and structural alignment.
Practical example on Gold (XAU): say price is approaching a demand zone at $2,340. On a bare chart it just looks like “a level.” With Flow Dynamics Pro, that zone might print a confluence score of 82 ”
you it’s a level with real institutional interest behind it, not a random line you drew. Compare that to a zone at $2,355 scoring 41. Same chart, two zones, and now you know which one to actually trade.
The score isn’t magic and it isn’t a buy button. It’s a filter. It tells you where the probability lives so you stop taking trades at levels nobody important cares about.
Step 3: Read the Pressure With Volume Dynamics Pro
Structure tells you where. Zones tell you which. Volume Dynamics Pro tells you the character of the move ”
advanced volume profile with butterfly profiles and gradient bias so you can see whether buyers or sellers dominate at a given price.
On NQ or ES futures, this is gold during the open. When the cash session opens and price tests an overnight high, Volume Dynamics Pro’s gradient bias shows you whether that test is backed by genuine buying pressure or whether it’s a thin, sellable push. A butterfly profile leaning heavily to the buy side into a resistance level ”
gold rejection ”
that’s the kind of read institutions act on while retail is still waiting for a candle to close.
Putting It Together: A Confluence Read
Order flow isn’t one indicator ”
these tools combine on a single TradingView chart:
- Volume Matrix Pro identifies the POC and a defended HVN at a key BTC level ”
$59,800. - Flow Dynamics Pro flags that same area as an institutional demand zone with a confluence score of 79.
- Volume Dynamics Pro shows gradient bias flipping to the buy side as price tags the zone ”
absorbing sellers.
Now you don’t have a level ”
idea. You have three independent reads agreeing. That’s confluence. That’s how you stop chasing green candles and start positioning before the move, the way desks do. And when none of them agree? You sit on your hands ”
stop loss.
How to Get These Running on TradingView
All ChartNation indicators are TradingView-native (Pine Script v6) ”
start with the free Volume Matrix Pro to learn volume structure, then unlock Flow Dynamics Pro and Volume Dynamics Pro on the Pro tier ($35/month) or the full suite on Ultimate ($59/month).
Access is simple: subscribe through Whop, head to the TradingView tab in your Whop dashboard, add your TradingView username, refresh TradingView, and the indicators appear under your Invite-Only Scripts. No waiting on an email ”
appear in your account.
Stop Trading the Lag
RSI and MACD will keep showing you the move after it’s gone. Order flow shows you the move while it’s forming. The difference between those two is the difference between entering at the top and entering with the institutions that created the top.
You can start reading real order flow on TradingView today. Start your 7-day free trial at chartnation.net and put Flow Dynamics Pro, Volume Dynamics Pro, and the full ChartNation suite on your charts ”
you guess.
Trading involves significant risk of loss. ChartNation indicators are tools for analysis only and do not constitute financial advice. Past performance shown is not indicative of future results.